For over 30 years, Steve has been doing research on past climate & oceanographic changes. He investigates changes during times when atmospheric carbon dioxide (CO2, the gas most responsible for global warming) was higher than today. The last time that CO2 was higher than today was 15 million years ago. This means that what humanity will do in lees than two centuries, Mother Nature could not do in 14 million years. With CO2 rising rapidly today due to fossil fuel use and changes in land use (e.g., cutting down forests, etc.), humanity has started an uncontrolled experiment that is like putting our climate on a “hot plate”. With greenhouse gases rising to levels not seen in over ten million years, exploring these past time intervals for him is like “Looking Back to Our Future”.
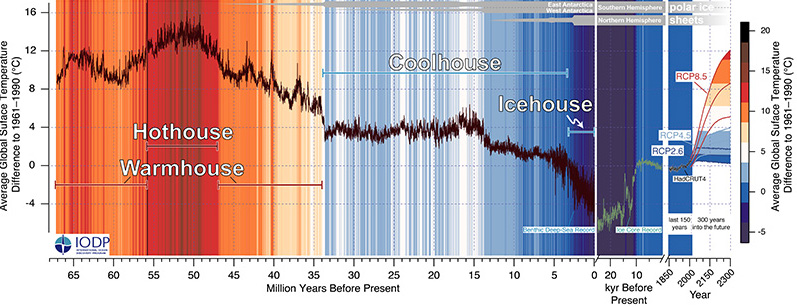
Westerhold Cenozoic Climate Figure Mod
This project has shown that ephemeral ice sheets existed in Antarctica during the Middle Eocene (51 to 41 Ma) (Pekar et al., 2005). In addition, current studies are extending this study into the early Eocene providing evidence of paleoceanographic changes and start of the opening of the Tasman Seaway.
In 2000, ODP Leg 189 recovered cores at five sites on the slopes of Tasmania and on the East Tasman Rise and South Tasman Rise, in 2,463 to 3,568 m water depths. Over 4,500 m of core were extracted with excellent overall recovery of 89%. From the sediments and microfossils recovered, high-resolution records were developed that greatly improved our understanding of Southern Ocean evolution and its relation with Antarctic climatic development. The relatively shallow region off Tasmania is one of the few places where well-preserved and almost-complete marine Cenozoic carbonate-rich sequences can be drilled in present-day latitudes of 40°-50°S and paleolatitudes of up to 70°S. In fact, sedimentological and paleontological evidence indicate that during the middle Eocene, the site of Site 1171 existed in a mainly neritic environment (<200 meters of water depth), with good to excellent preservation of the calcareous microfossils.

Figure 1. Reconstruction of the positions of Australia and Antarctica at ca. 52 Ma, modified from Brown et al. (2006).
Shown are locations of ODP Leg 189 Site 1171 and other IODP and ODP sites as well as Seymour Island. Site 1171 is located on the South Tasman Rise, which was located adjacent to the East Antarctic coast. Note that Site 1171 was the most the southerly site to have the Early and early Middle Eocene strata preserved.

Figure. Age model for Site 1171 between 400 and 940 mbsf.
Bio- and magnetostratigraphic data are from Stickley et al. (2004) and Exon et al. (2004). Black lines represent sedimentation history at Site 1171 between 54 and 42 Ma. Linear regressions for each portion of the age model are indicated. Gradstein et al. (2004) time scale is used throughout. In the X-axis, the polarity chrons, insolation, eccentricity, and obliquity are shown. Sequence boundaries are shown either by a circle or a wavy line. Oxygen isotope events are from Pekar et al. (2005) are shown by red lines. Polarity data are shown here. Polarity data were reinterpreted in this study resulting in minor changes in the age model from previous studies (e.g., Pekar et al., 2005). Density, photospectrometry L* (light intensity) and a* (green versus red color) and grain size data are also shown.
Each of the sequence boundaries correlate well with the ~1.2 Myr obliquity minimum nodes. Additionally, sequence boundaries at 51.4-50.2 Ma, 49.2 Ma, and 46.8 Ma with the 2.4 Myr eccentricity minima.
I was selected as one of the on board sedimentologists for ODP Leg 189. One of the research projects I worked on was developing high-resolution lithologic and foraminiferal biofacies records for the early to middle Eocene (51-42 Ma) section of Site 1171. During initial lithologic description on board ship, I identified lithologic cycles that were subsequently placed into a sequence stratigraphic framework. Post cruise studies developed high-resolution sedimentological and foraminiferal biofacies records that permitted identification of sequences their bounding unconformable surfaces and systems tracts within (LINK Pekar et al 2005.pdf>. Sequence boundaries were identified and dated using lithology, bio- and magnetostratigraphy, water-depth changes, CaCO3 content and physical properties (e.g., photospectrometry). They were often characterized by a sharp bioturbated surface, low CaCO3 content, and an abrupt increase in glauconite above the surface. Foraminiferal biofacies and planktonic/benthic foraminiferal ratios were used to place constraints on water-depth changes.
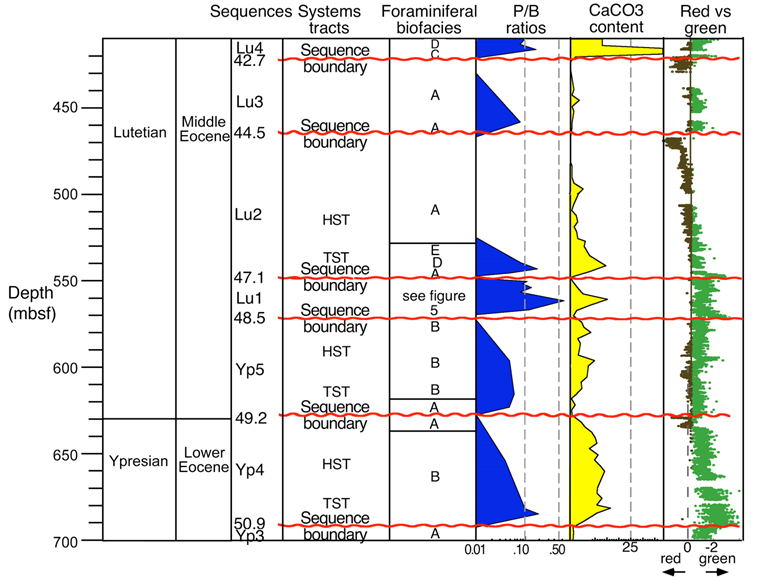
Summary figure modified from Pekar et al. (2005) for Site 1171 between 700 and 400 mbsf. Systems tracts terminology based on Posamentier et al. (1988). Increased redness in the sediment (more positive a*) generally indicates lower nannofossil content, while more greenness (more negative a*) indicates higher nannofossil percent. Increased green can also indicate higher glauconite content. Higher CaCO3 content is used as a proxy for higher nannofossil abundance. Calcium carbonate percents, photospectrometry, and nannofossil and glauconite percent (from smear slides) are from Exon, Kennett, Malone et al. (2001).
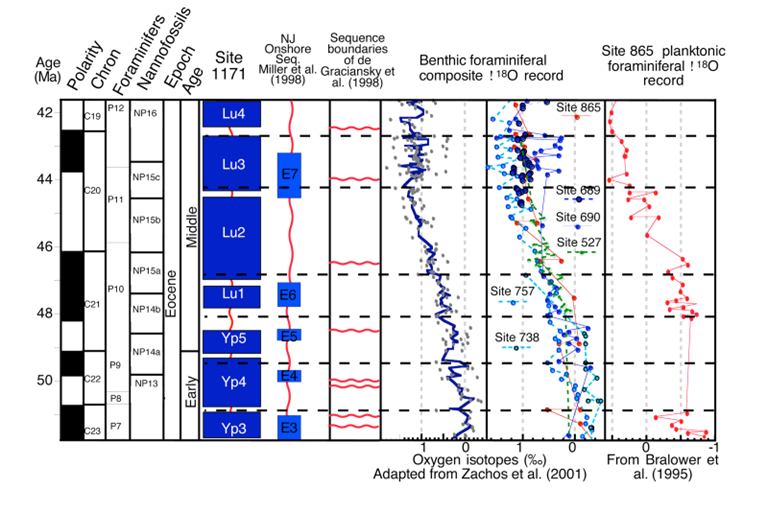
Figure modified from Pekar et al. (2005). Comparison of sequence development at ODP Leg 189 Site 1171, deep-sea oxygen isotope records and events, and sequence boundaries identified in New Jersey (Browning et al., 1996) and Europe (de Graciansky et al., 1998). Yp3-5 and Lu1-4 are Eocene sequences identified in Site 1171 and E4-E9 are Eocene sequences identified in New Jersey. Shaded boxes indicate time represented by sediments and curved lines represent hiatuses. Horizontal wavy lines show ages of sequence boundaries of de Graciansky et al. (1998). Composite d18O record from Deep Sea Drilling Project (DSDP) and Ocean Drilling Program (ODP) sites from Zachos et al. (2001). Oxygen isotope events (dashed gray lines) represent inferred ice growth and were defined on the basis of substantial global increases (>0.5 per mil) in benthic oxygen isotope values and coeval shifts in western equatorial planktonic oxygen isotope records (Bralower et al., 1995). Each event corresponds with a sequence boundary (inferred base-level lowering) at Site 1171. Additional peaks evident in these records were not recognized globally in benthic foraminiferal oxygen isotope data (i.e., at more than one site) or have not been identified in western tropical planktonic oxygen isotope data. These peaks may represent local variability (i.e., bottom-water temperature changes) or perhaps higher frequency events not recognized previously. In all of the isotope records, the potential exists for aliasing of obliquity and precessional Milankovitch cycles.
Ages of six sequence boundaries (50.9, 49.2, 48.5-47.8, 47.1, 44.5 and 42.6 Ma) from Site 1171 correlate well to the timings of oxygen isotope increases (inferred ice volume increase) and sequence boundaries (inferred sea level lowering) identified from other Eocene studies. The synchronous nature of sequence boundary development from globally distal sites and oxygen increases indicates a global control and that glacioeustasy was operating in this supposedly ice free world. Estimates of sea-level amplitudes range from ~20 m for the early Eocene (51-49 Ma) and ~25 m to ~45 m for the middle Eocene (48-42 Ma) using constraints established for Oligocene oxygen isotope records.
Resolving apparent conflicts between oceanographic and Antarctic climate records and evidence for a decrease in pCO2 during the Oligocene (34–23 Ma)
Abstract:
An apparent mismatch between published oxygen isotopic data and other paleoclimate proxies for the span from 26–16 Ma is resolved by calibration against global sea-level estimates obtained from backstripping continental margin stratigraphy. Ice-volume estimates from calibrated oxygen isotope data compare favorably with stratigraphic and palynological data from Antarctica, and with estimates of atmospheric pCO2 throughout the Oligocene to early Miocene (34–16 Ma). Isotopic evidence for an East Antarctic Ice Sheet (EAIS) as much as 30% larger than its present-day volume at glacial maxima during that span is consistent with seismic reflection and stratigraphic evidence for an ice sheet covering much of the Antarctic continental shelf at the same glacial maxima. Palynological data suggest long-term cooling during the Oligocene, with cold near-tundra environments developing along the coast at glacial minima no later than the late Oligocene. A possible mechanism for this long-term cooling is a decrease in atmospheric pCO2 from the middle Eocene to Oligocene, reaching near pre-industrial levels by the latest Oligocene, and remaining at those depressed levels throughout the Miocene.
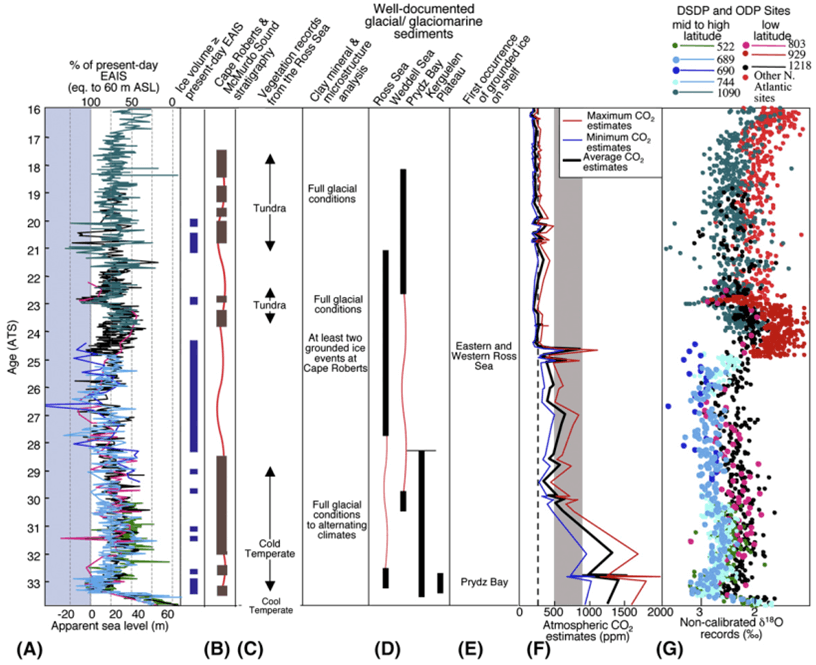
(A) Apparent sea-level (ASL) estimates are derived by applying d18O to ASL calibrations to d18O records (Pekar et al., 2002, 2006) from Sites 522, 689, 690, 744, 803, 929, 1090, and 1218. The upper x-axis is the percent of the present-day EAIS (equivalent to ~60 m ASL). The lower x-axis is ASL change, with zero representing sea level resulting from ice volume equivalent to the present-day EAIS, and with increasing values representing sea-level rise and negative numbers representing ice volume greater than the present-day EAIS volume. Good agreement exists between the ice-volume estimates from each of the calibrated records, in spite of different calibrations being used for each record. Thick blue lines represent
times when ice volume was > than present-day EAIS based on calibrated isotopic records. (B) Thick brown lines represent times for which sediment was preserved and the red wavy lines represent times for which hiatuses have been identified in cores from the Cape Roberts Project (based on Florindo et al., 2005). Note the excellent agreement between ice volume $ than present-day EAIS and the timings of the hiatuses. (C) Biological (Askin, 2001) and sedimentological (Ehrmann, 2000; van der Meer, 2000) data from Cape Roberts Project that show evidence for long-term climate cooling and full glacial conditions in Antarctica. (D) Well-documented glacial/glaciomarine sediments shown in brown lines, with red wavy lines indicating hiatuses and horizontal line indicating top of recovered sediments. (E) First occurrence of grounded ice based on core and seismic data
around Antarctica (Cooper et al., 1991; Hambrey et al., 1991; Bartek et al., 1997; Chow and Bart, 2003; Sorlien et al., 2007). Note that evidence for grounded ice 550 km beyond the present-day location in Prydz Bay during the Oligocene suggests a much larger ice sheet existed than is present today (Hambrey et al., 1991). (F) pCO2 estimates from Pagani et al. (2005) show decreasing values during the Oligocene, reaching pre-industrial levels by the latest Oligocene and continuing into the early Miocene. The range shown in pCO2 is due to the uncertainty involved in using carbon isotopic composition of sedimentary alkenones (!13C 37:2). The dashed line represents pre-industrial values (280 ppm), while the shaded box
represent values that are predicted for the present century (Watson et al., 2001). (G) Deep-sea d18O composite modified from Zachos et al. (2001), and including Sites 803 (Barrera et al., 1993), 1090 (Billups et al., 2002), and 1218 (Lear et al., 2004). The abrupt d18O decrease at circa !24.5 Ma is due to a change in the source of data from high latitude to low-latitude sites, with Southern Ocean sites below and mainly western equatorial Atlantic Site
929 above (Pekar et al., 2002, 2006). Recently published isotopic records from Sites 1090 and 1218 (dark blue and black circles, respectively) are characterized by generally heavier values than those used in the 2001 composite for the latest Oligocene and early Miocene, consistent with our interpretation of a more heavily glaciated Antarctic continent.
Resolving a late Oligocene conundrum: Deep-sea warming and Antarctic glaciation
Changes in ice volume and resulting changes in sea level were determined for the late Oligocene (26–23 million years ago, Ma) by applying d18O -to-sea-level calibrations to deep-sea d18O records from ODP Sites 689, 690, 929, 1090, and 1218. Our results show that maximum global ice volume occurred during two late Oligocene d18O events, Oi2c (24.4 Ma) and Mi1 (23.0 Ma) (inferred global sea level lowering from glacial ice decrease), with volumes up to ~25% greater than the present-day East Antarctic Ice Sheet (EAIS). Ice volume during glacial minima was on the order of about 50% of the present-day EAIS. This is supported by late Oligocene stratigraphic records from Antarctica that contain evidence of cold climates, repeated glaciation at sea level, and grounding lines of glacial ice on the Antarctic continental shelf in the Ross Sea and Prydz Bay. In contrast, composite deep-sea d18O records show a significant decrease between 26.7 and 23.5 Ma, which has long been interpreted as bottom-water warming combined with the deglaciation of Antarctica.
However, a close examination of individual d18O records indicates a clear divergence after 26.8 Ma between records from Southern Ocean locations (i.e., Ocean Drilling Program Sites 689, 690, 744) and those of other ocean basins. High d18O values (2.9‰–3.3‰) from these Southern Ocean d18O records are consistent with an ice sheet on the East Antarctic continent equivalent to present-day values and cold bottom-water temperatures (~ 2˚C). These differences suggest a reduction in deep water produced near the Antarctic continent (i.e., proto-Antarctic Bottom Water, proto-AABW), which was quickly entrained and mixed with warmer (and presumably more saline) bottom water originating from lower latitudes. The expansion of a warmer deep-water mass and the weakening of the proto-AABW may explain the large intrabasinal isotopic gradients that developed among late Oligocene benthic d18O records. These conclusions are also supported by ocean modeling suggesting a reduction of deep water formed in the Southern Ocean, strengthening of deep water from the Northern Hemisphere, and decreasing temperatures in high southern latitudes occurred as the Drake Passage opened to deep water. Low d18O values reported from deep-sea locations other than the Southern Ocean are shown to bias estimates of Antarctic ice volume, calling for a re-evaluation of the notion that Antarctic ice volume was significantly reduced during the late Oligocene.
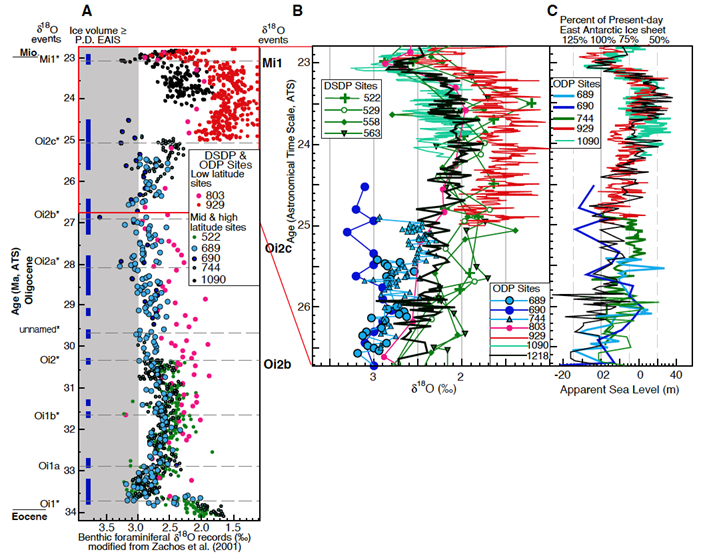
(A) Oligocene benthic foraminiferal d18O records are from Barrera et al. (1993) and modified from Zachos et al. (2001). Blue circles are from Southern Ocean sites, green circles are from mid-latitude sites, and pink and red circles are from low latitude sites. The abrupt d18O decrease at circa 25.5 Ma is due to a change in the source of data from high latitude to low latitude sites, with Southern Ocean sites below and mainly western equatorial Atlantic Site 929 above (Pekar et al., 2002).
(B) Oxygen isotope records for the late Oligocene showing the divergence in the records (from Barrera et al., 1993; modified from Zachos et al., 2001; Billups et al., 2002; Lear et al., 2004). Isotopic values of > 3‰ are consistent with carbonate that formed in water of 2 ˚C concomitant with a fully glaciated Antarctic continent during the late Oligocene. Oxygen isotope values from Cibicidoides spp. are depleted relative to isotope equilibrium and were adjusted accordingly by 0.64‰ (Graham et al., 1981). On the left are d18O events from Miller et al. (1991) and Pekar and Miller (1996).
(C) Apparent sea-level (ASL) estimates are derived from application of d18O to ASL calibrations to d18O records from Sites 689, 690, 744, 929, 1090, and 1218. The upper x-axis is the percent of the present-day EAIS (equivalent to ~60 m ASL). The lower x-axis is apparent sea-level change, with zero representing sea level resulting from ice volume equivalent to the present-day EAIS, with increasing values representing sea-level rise and negative numbers representing ice volume greater than the present-day EAIS volume.
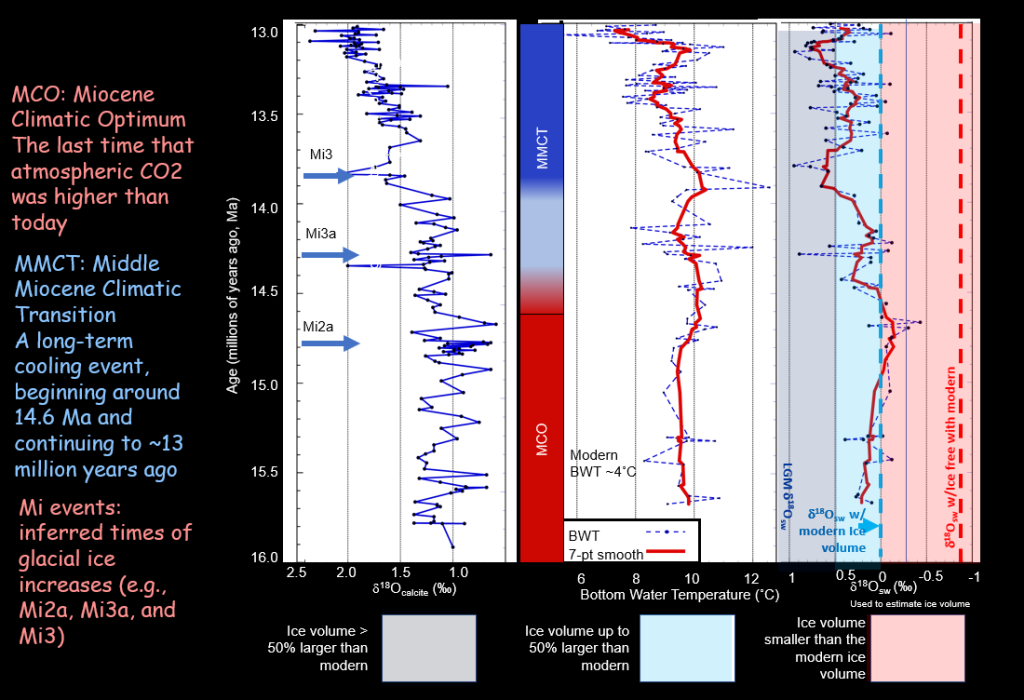
Here is the mystery!!
Between 14 and 17 million years ago
Atmospheric CO2 was much higher than today (450-600 ppm)
Stratigraphic records from continental margins indicate sea level was 100 feet higher (i.e., less ice volume), and deep-sea records show warm bottom water temperatures
However, the d18O and Mg/Ca ratios from nearly all deep-sea records showed extremely large amounts of ice in Antarctica.
What is going on?